
6:30 PM
Sunday, August 6, 2017

Friday, August 4, 2017
briefing
3:45 PM
Recent Jobs Report Could Be Bad News for Tech Stocks.
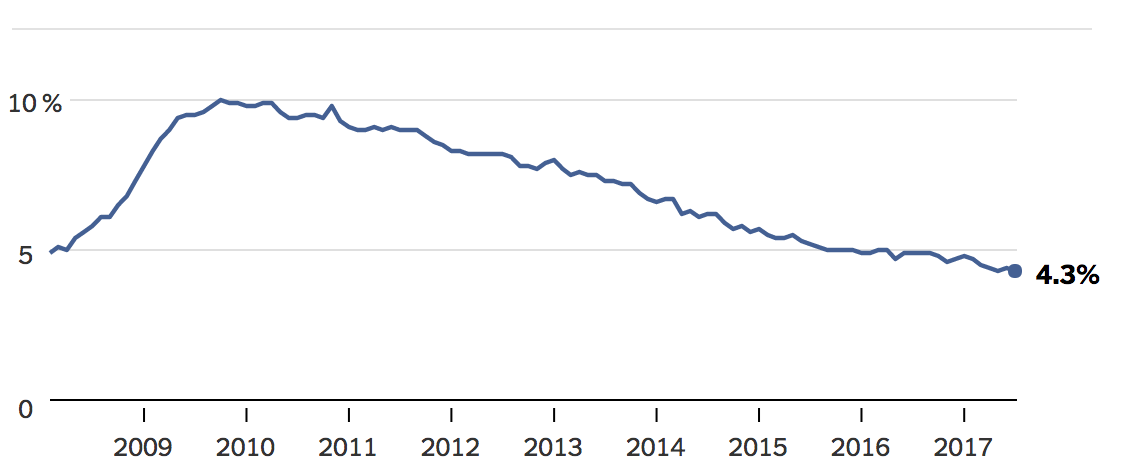
Just when market pundits were getting ready to publish another round of articles mocking the Phillips curve, something amazing happened, wage growth. Friday’s jobs report showed optimistic numbers with a seasonally adjusted rise of 209,000 (180,000 exp.) and the unemployment rate ticking down to 4.3% from 4.4%. The main attraction was wage growth. From a month earlier, there was a 9 cent increase, the largest gain since October. Although this is still relatively small it is much better than the dismal, numbers we have been seeing in the past few reports.

This report will only solidify the Fed’s recent stance on gradual tightening and reduction of its balance sheet. Even with dismal inflation and jobs reports recently, the Fed hasn’t wavered from their direction. A positive report like this one will only underscore their recent direction. This presents a very optimistic view of our economy, but may not be the same for the stock market specifically the technology sector.
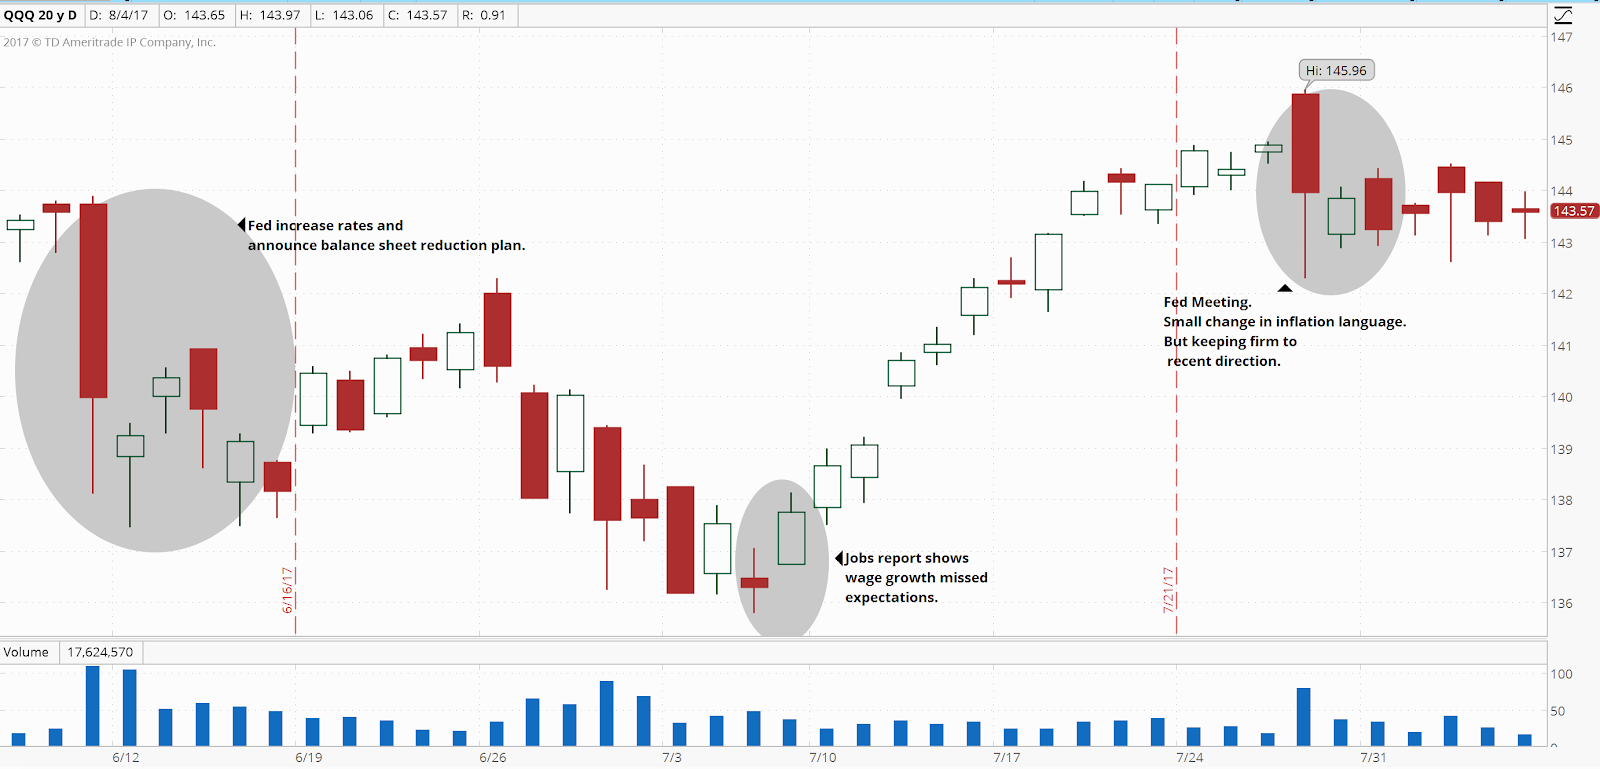
Around the time of the last rate hike in June, we saw strong declines in the Nasdaq. These declines were attributed to overvaluation of stocks in the index as well an impending announcement from the Fed on reducing its balance sheets. Since then it recovered those losses and has set new all time highs. What’s interesting to note in this recent rally is that it started Friday, July 7th, after the release of the jobs report. This job report showed the economy added overall jobs but showed wage growth missing expectations. This added fuel to the fire of the story that inflation and wage growth data is not meeting expectations and the Fed will have to slow down their path. This story added optimism and the Nasdaq rallied again.
During this period the Nasdaq has been showing a negative correlation with the USD/JPY pair. The USD/JPY represents one of the most heavily traded dollar forex pairs. As its value goes up it represents a strengthening dollar and vice versa. The 20-day correlation with the Nasdaq and the USD/JPY is -.8. It has also had a 20- day correlation with the 10Y yield at -.8. This negative correlation shows that as yields rise investors are retreating from the technology stocks. This makes sense fundamentally if yields are becoming attractive and risk free, why would I want to be in overvalued risk assets? Of course we can’t conclude this as the causation but it’s very interesting nonetheless.
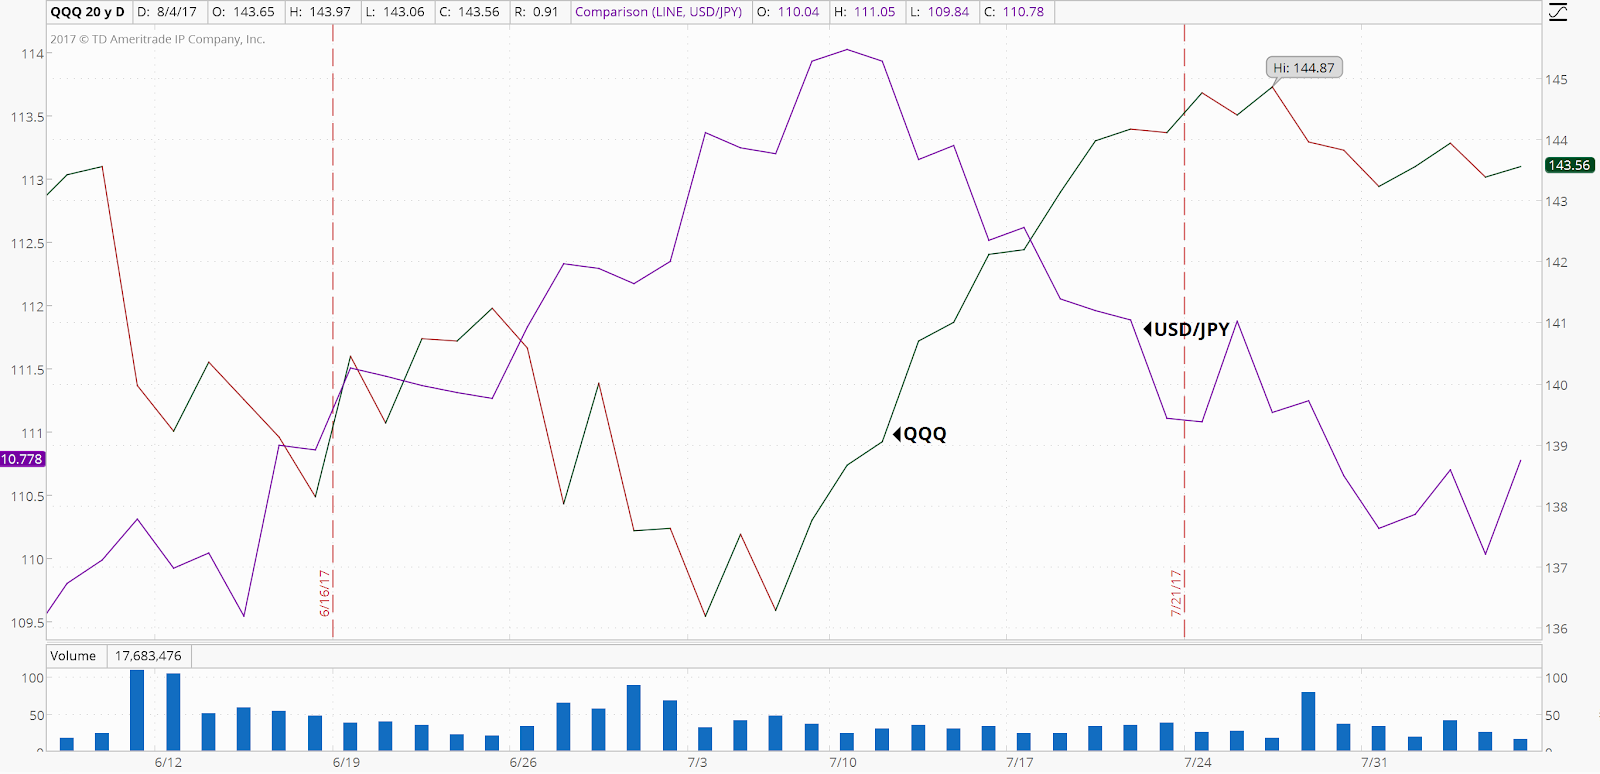
QQQ and USD/JPY
We can’t also ignore the PCE inflation data earlier this week that also beat expectation coming in at 1.5%. It was not a notable number but it showed a little bit of optimism to the recent inflation story we have been seeing lately. I personally believe that there will be a lot of de-risking from tech stocks in the coming week especially with the Personal Consumption Index (PCI) data coming in. Next week’s PCI data will likely serve as another catalyst in either direction. I would seriously asses my exposure to the technology sector.


Monday, July 31, 2017
3:11 PM
Euro Breaks Above 200 Weekly MA

The Euro has broken over is 200 Weekly moving average which is a big break through. It is not certain if this a fakeout or a breakout but signs right now point to a breakout. Geramny Data comes out tomorrow morning and can serve as a catalyst to continue the move higher, as political uncertainty continues to weigh down on the U.S. Dollar.
The next resistance is from a 2010 swing low at the 1.19 area.

Wednesday, July 12, 2017
8:04 PM
Crude Oil Shows Corrective Pattern #OOTT

It seems that crude oil is set up in a corrective wave pattern that could lead to a strong bullish move up. Crude Oil has shown signs that the recent downtrend may soon be coming to an end. After exhibiting five waves similar to Elliot waves, crude oil has started to form a corrective pattern. Todays
Summary
- Recent Crude Oil reports from the EIA have shown drawdowns in US Stockpiles.
- Rumors from OPEC to soon cap Libya and Nigeria output
- After retracing to the 78.6% of each move, during prior moves down, the most recent move down retraced to only 50% retracemnet of the move.
- The downtrend failed to capture a new lower low
With the above factors in mind, we are watching for any sign of a new upward trend. Here is a summary today's EIA below if you missed it.

Source: EconDay


