

Over the past two weeks, oil prices have officially entered a bear market. Some analysts have called for year end prices sub $40, but I believe they will remain above $46 a barrel this year. To analyze this, I look at are the main factors that could affect oil prices and then look at the technical analysis on the crude oil price chart.
Right now, with OPEC having their production cap extended, the biggest threat in my opinion is the United States Shale Production. When analyzing the data I believe this is the reason for the imbalance in the global market and why OPEC does not have they power they once held. For this purpose I am going to use US oil stockpiles, gasoline stockpiles, and rig counts.
The first thing I did was to test for correlation with crude oil prices using data from the beginning of 2017. From the table below we can see the strongest correlation is a negative correlation of 77.67% with the number of active rigs available.The second strongest correlation is with the gasoline stockpiles which is at 54.97%. This shows that these two factors could have the strongest effect on oil prices

Correlation Table uses Weekly closing price of WTI Crude Futures that correspond to that week of daa
At first glance of the rig count and gasoline stockpile data, it seems as though US production is starting to slow down which is a bullish signal for oil.
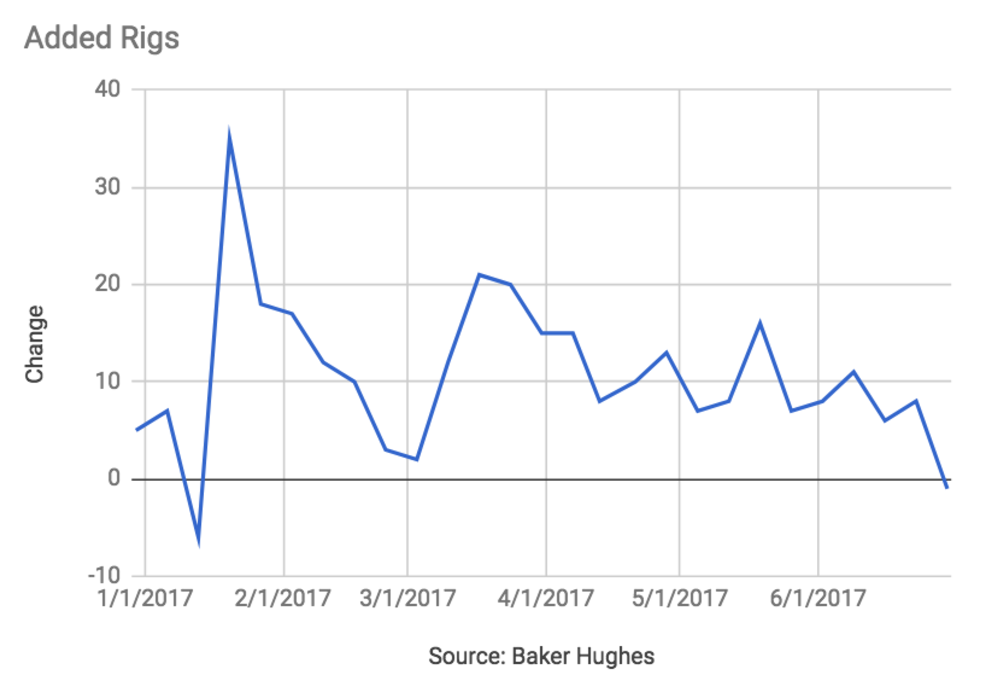
Based on the graph of the recent addition of rigs, we can start to notice a downtrend being formed.

Looking at gasoline stockpiles, we can see a downtrend being formed there as well.
To dive deeper into the data, I used the rig count and gasoline stockpiles data, to build a very simple multivariable regression, to model out what the oil price should be based off of the data. Using them as independent variables to determine crude oil prices, the regression gave an R Squared value of .61. The results are below
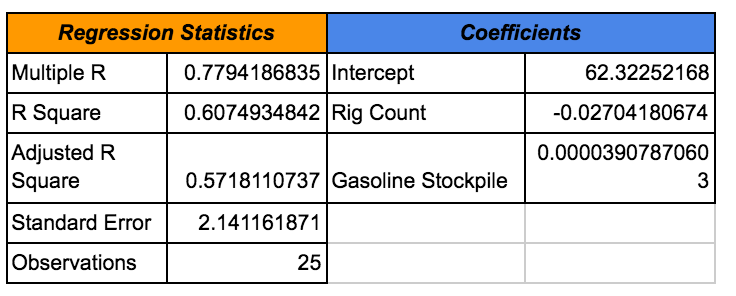
Rig count data based on June 30, 2017 Baker Hughes Rig Report. Gasoline Stockpile data based on the June 28, 2017 EIA Petroleum Status Report.
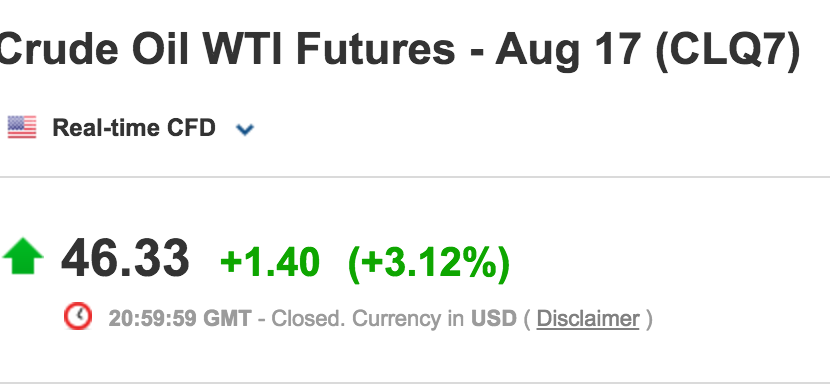
Crude Oil Prices as of June 30, 2017
Mathematically from this model, oil price should be $46.32. As of closing price on Friday, June 30, 2017, WTI Crude Oil futures were $46.33. The model depicts a more accurate movement of oil prices and shows that a lot of the fluctuation could be considered noise as the prices always reverted back. If you were to have used this model in your trading decisions this week, you could have taken advantage of oil’s recent bounce. Below is a graph that shows this model and crude oil prices.
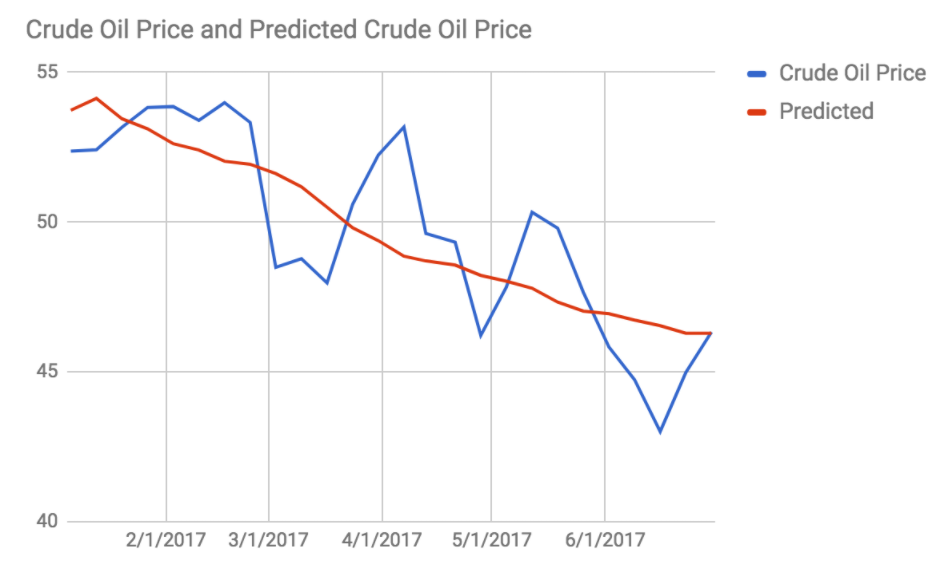

According to the Model, oil’s recent decline to $42.55 was overdone and oil prices were going to bounce back higher
Recent Commitment of Traders reports, a report that shows positions in future contracts, show funds have close to record high short positions in crude oil. Last time shorts were this high on May 9th, crude oil saw a 14% rally in the following 2 weeks. The recent trend down is probably caused by CTA’s which usually follow trends. Because of such high short positions, any bullish fundamental factors could break the trend and cause a squeeze in oil prices.

There are also factors from the technical analysis side that also support a rebound. On the technical side of trading, price action cleared the 20 day moving average (brown line) which sometimes behaves as a first form of dynamic resistance. The 50 day moving average (green line) stands currently at 47.17 which is usually the next goal technical traders look for. See chart below

Crude prices have also made its downward move at $42.55 which is a strong support formed back in November 2016 at an important Fibonacci retracement level at 61.8% drawn from April 2016 lows. This price level was very crucial for it to hold. If it closed below this we could have seen sub $40 prices from a technical standpoint. Crude Oil being able to hold that price is a good sign. See Chart Below

Although I see further rebound in oil prices I do not believe we will see oil prices over $55 until we see supply cuts from either OPEC or the United States. My 2017 outlook for crude oil is for it to stay above $46 a barrel there are certain factors that could bring us back to sub $42 prices. Some of those factors are, OPEC members reneging on their pact, drilling activity in the United States picks back up unexpectedly, or gasoline stockpiles to increase. With those main factors in mind oil prices should rebound and stay above $46 a barrel.
DISCLAIMER: THIS IS JUST COMMENTARY AND SHOULD NOT BE TAKEN AS INVESTMENT ADVICE OR RECOMMENDATIONS.


No comments:
Post a Comment